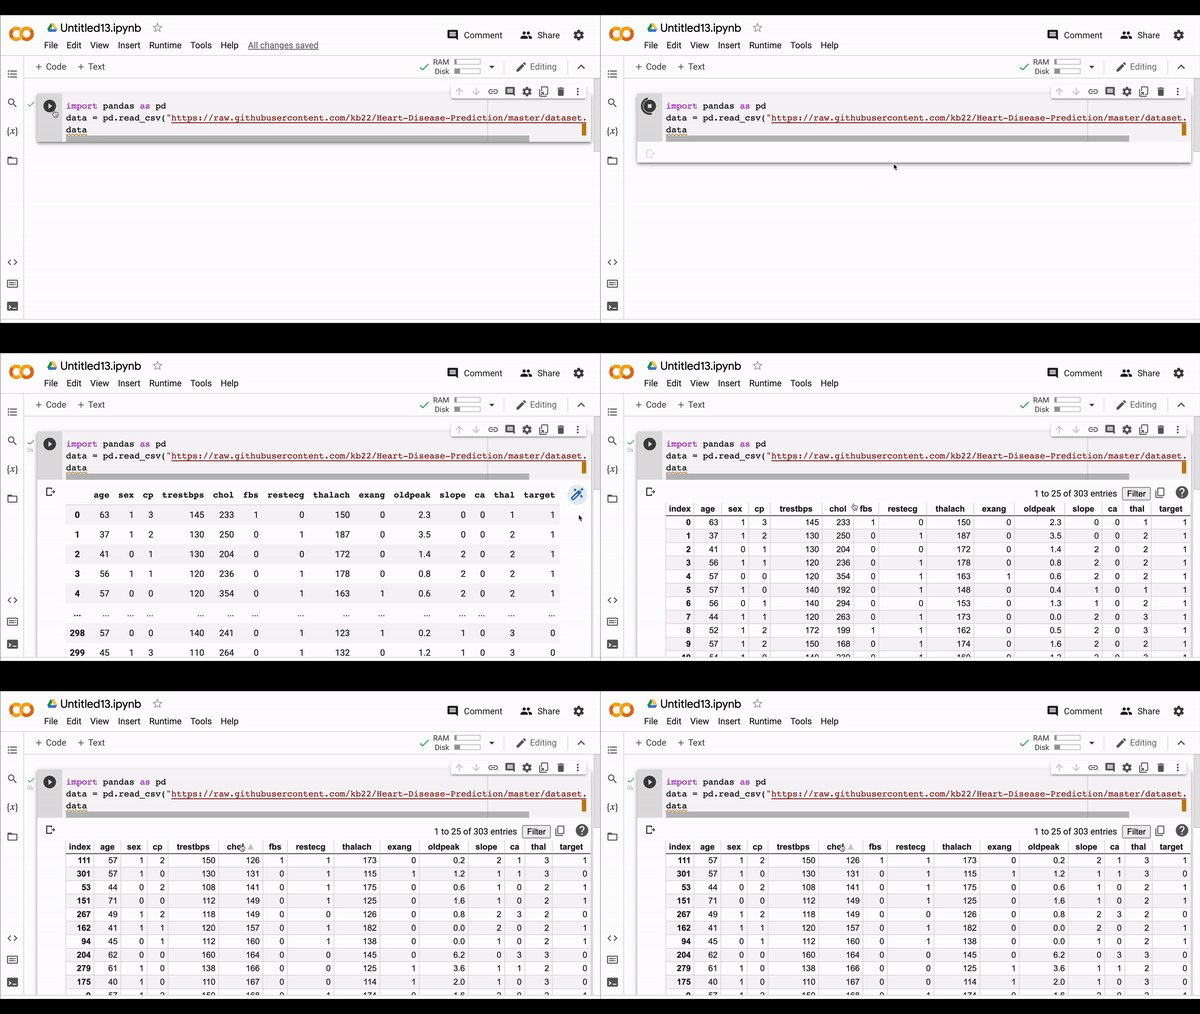
Make your dataframes come alive!

Pandas is a wonderful tool for analyzing data in Python but wouldn’t it be nice if your dataframes could be a bit more interactive? Imagine being able to easily sort and search your data without having to write additional code. Well, in Colab that feature is just a mouse click away.
Let’s load a dataframe with some heart disease prediction data and display the first few rows:
python import pandas as pd data = pd.read_csv("https://raw.githubusercontent.com/kb22/Heart-Disease-Prediction/master/dataset.csv") data.head()
As expected, Pandas renders the table nicely, but it also includes a little magic wand, as highlighted here:

Clicking the wand re-renders the dataframe as an interactive table, like this:

Now you can dynamically explore the data, for example, you can:
- reorder the rows by clicking on a column header
- filter the data based on arbitrarily ranges on one or more columns
- copy your data to the clipboard in csv, markdown, or json formats
You can also skip the mouse click and automatically render your dataframes in this style by default, by running this code near the top of your notebook:
python from google.colab import data_table data_table.enable_dataframe_formatter()
This feature can make your exploratory data analysis a bit more efficient and fun — give it a try!
Learn more about interactive tables in this notebook or see them live in this excellent video by my colleague Nate.